
Anecdotally, it’s known that most startups fail. But looking at the data, we can see the hard truth in the numbers and better understand where in the funding lifecycle startups begin to lose traction.
We followed a cohort of over 1,100 startups from the moment they raised their first seed investment to see what happens to them empirically.
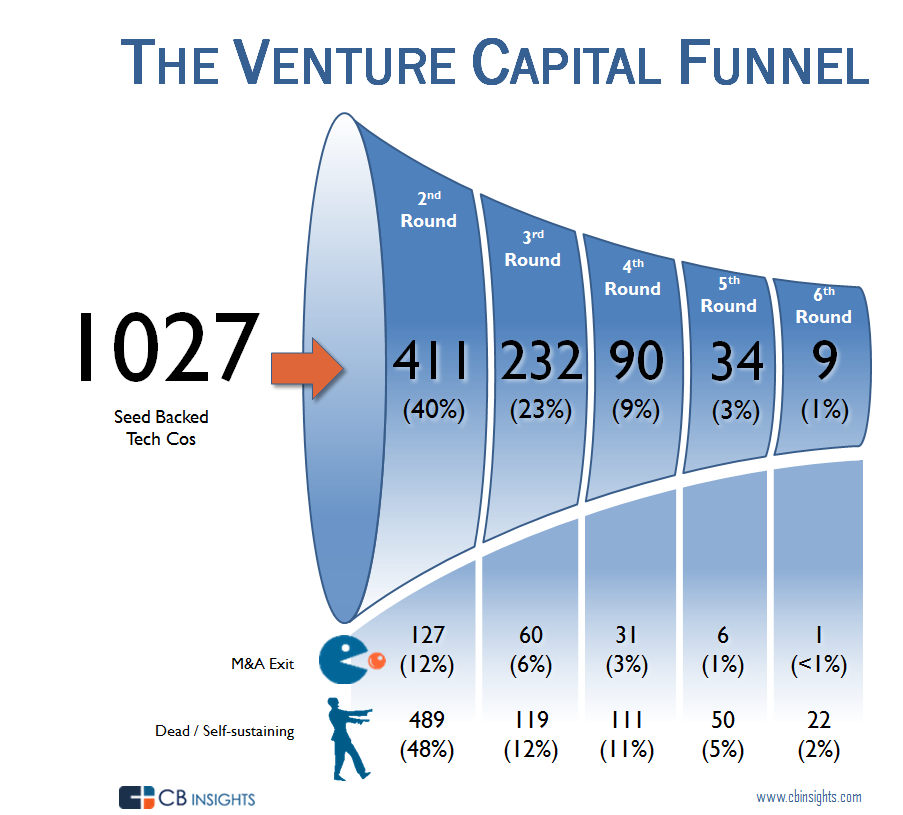
So, once you take your first bit of seed funding, what can startup founders expect? The data bears out the conventional wisdom: nearly 67% of startups stall at some point in the VC process and fail to exit or raise follow-on funding.
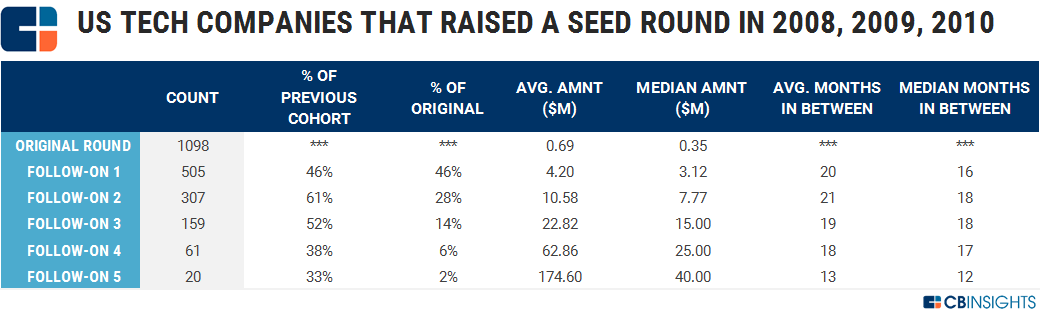
In our latest analysis, we tracked over 1,100 tech companies that raised seed rounds in the US in 2008-2010. Less than half, or 48%, managed to raise a second round of funding. Every round sees fewer companies advance toward new infusions of capital and (hopefully) larger outcomes. Only 15% of our companies went on to raise a fourth round of funding, which typically corresponds to a Series C round.
The data below gives a more detailed look at the outcomes.
What we found:
- There was a 2 percentage point increase from 46% to 48% in companies raising a first follow-on round in our updated analysis.
- 30% of seed funded companies exited through an IPO or M&A, up by 2 percentage points from last year.
- 67% of companies end up either dead, or become self-sustaining (maybe great for the company but not so great for investors). This was a 3 percentage point decrease since our last analysis. It is hard to know the exact breakdown for these companies as funding announcements get a significant amount of fanfare but cash flow positivity or profitability does not. Also, some companies stumble on as zombie companies for years before calling it quits. Not to mention, the death of companies generally happens without any official announcement, i.e. there is no such thing as a “startup death certificate” (although increasingly, startups are willing to share their failure post-mortems).
- Not surprisingly the odds of becoming a unicorn remained low in our new analysis, hovering around 1% (1.07%), with 12 companies reaching that status. Some of these companies are the most-hyped tech companies of the decade, including Uber, Airbnb, Slack, Stripe, and Docker.
- 13 companies exited for over $500M, including leading companies within their categories like Instagram, Zendesk, and Twilio.

Some other metrics:
- While almost half (48%) of companies raise their first follow-on round, more than half (63%) of these companies went on to raise their second follow-on round which tends to be at the Series B stage.
- Average time to raise between months stayed fairly consistent across all the rounds, at about 20 months. At the 6th round the time to raise a follow on drops off by about 5 months, which is a small cohort of later-stage companies, but it shows that investors are a lot more eager to invest at this point.
- The median seed disclosed deal size was $350K while the average was $670K, and the gap between median and average round sizes tends to increase over time, showing that mega-rounds in later stages skew the average upward. By the sixth follow-on round, the median round amount was $40M but the average was $120M.

Methodology:
- This analysis contains a cohort of tech companies headquartered in the US that raised their first round of seed funding either in 2008, 2009, or 2010 and follows them through to August 31, 2018. Given the date range, these companies have had a substantial amount of time to obtain follow-on funding and exit.
- Tranches are not counted as follow-on rounds, only equity rounds are counted as follow ons.
- Of note, seed deals were on the whole less prominent in 2008-2010 than they are now. They’ve risen in popularity in the last few years with the explosion of micro VCs and the greater frequency of seed deals by multi-stage funds. If we were to repeat this analysis a few years from now, the numbers could look very different and there would likely even be a smaller proportion of companies obtaining Series A and Series B funding.
03/29/2017 Analysis
Of the 1,098 tech companies we tracked that raised seed rounds in the US in 2008-2010, less than half, or 46%, managed to raise a second round of funding. Every round sees fewer companies advance toward new infusions of capital and (hopefully) larger outcomes. Only 14% of our companies went on to raise a fourth round of funding, which typically corresponds to a Series C round.
The data below gives a more detailed look at the outcomes.
But first some notes:
- This analysis contains a cohort of tech companies headquartered in the US that raised their first round of seed funding either in 2008, 2009, or 2010 and follows them through to February 28, 2017. Given the date range, these companies have had a substantial amount of time to obtain follow-on funding and exit.
- Tranches are not counted as follow-on rounds, only equity rounds are counted as follow ons.
- Of note, seed deals were on the whole less prominent in 2008-2010 than they are now. They’ve risen in popularity in the last few years with the explosion of micro VCs and the greater frequency of seed deals by multi-stage funds. If we were to repeat this analysis a few years from now, the numbers could look very different and there would likely even be a smaller proportion of companies obtaining Series A and Series B funding.
What we found:
- Close to half (46%) of companies that raised their initial seed in 2008–2010 ended up raising a second round of funding.
- 306 (28%) of companies that raised a seed round in 2008–2010 exited through an M&A or IPO within 6 rounds of funding.
- Less than 1%, 10 (0.91%) companies from our seed cohort ended up becoming unicorns valued at $1B+. Some of these companies are the most-hyped tech companies of the decade, including Uber, Airbnb, and Slack.
- 70% of companies end up either dead, or become self-sustaining.

Some other metrics:
- The median seed disclosed deal size was $400K while the average was $700K, and the gap between median and average round sizes increases over time, showing that mega-rounds in later stages skew the average upward. By the fifth follow-on round, the median round amount was $40M but the average was $175M.
- 61% of companies that raise a follow-on after their initial seed are then able to raise a second follow-on round after that. In other words it is easier for companies to raise a second post-seed financing than a first post-seed financing.
- 10 companies exited for over $500M from this cohort, with only 5 exiting for over $1B+, indicating the rarity of such high exit valuations. The $1B+ exits among our cohort include Nutanix, Covermymeds, Twilio, Trade Desk, and Instagram.
12/9/2015 Analysis
Below you can take a look at our previous analysis, which looked at companies that raised seed rounds in 2009 and 2010 and follows them through 11/19/2015.
But first some notes:
- This report analyzes a cohort of tech companies that raised seed funding in 2009 and 2010, and follows them all the way through 11/19/2015. This is a sufficiently mature vintage for us to conduct this analysis on, i.e. these companies have had enough time to succeed, or fail.
- Of note, Seed deals were on the whole less prominent in 2009-2010 than they are now. They’ve risen in popularity in the last few years with the explosion of micro VCs and the greater frequency of Seed deals by multi-stage funds. If we were to repeat this analysis a few years from now, the numbers could look very different.
Some of our findings:
- Less than half (40%) of companies that raised a Seed or Seed VC round in 2009-2010 raised a second round of funding.
- 225 (22%) of companies that raised a Seed in 2009-2010 exited through M&A or IPO within 6 rounds of funding (1 exited after the 6th round of funding, for a total of 226 companies)
- 9 companies (0.9%) that raised a Seed round in 2009-2010 reached a value of $1B+ (either via exit or funding round) including Instagram, Uber, and Slack.
- 77% of companies are either dead, the walking dead (bad outcomes), or became self-sustaining (a potentially good outcome for the company but probably not good for their investors). It is hard to know the exact breakdown for these companies as funding announcements get a significant amount of fanfare but cash flow positivity or profitability do not. Also, death of companies generally happens quietly in the middle of the night (although increasingly, startups are willing to share their failure post-mortems).
Looking at the breakdown by round, there are some more interesting findings:
- The median Seed size disclosed was $500K for companies that raised their Seed in 2009-2010
- 56% of companies that raise a follow-on round after their Seed are then able to raise a second follow-on round after that. In other words, it’s easier to raise a second post-Seed financing than the first post-Seed financing (as noted, only 40% of companies are able to raise a post-Seed round). However, as companies move into the middle and late stages, the proportion of companies that manage to raise follow-on capital decreases. For the 3rd follow-on round after Seed the percentage drops to 39%, and then to 38% for the 4th and so on.
- In the later follow-on rounds, the gap between the average amount raised and median amount raised becomes much higher, indicating the presence of mega-rounds

For entrepreneurs who’ve raised multiple rounds of financing or venture capital investors making the decision to invest in companies, how does the funnel above parallel your experiences? Look forward to your comments below.
This report was created with data from CB Insights’ emerging technology insights platform, which offers clarity into emerging tech and new business strategies through tools like:
- Earnings Transcripts Search Engine & Analytics to get an information edge on competitors’ and incumbents’ strategies
- Patent Analytics to see where innovation is happening next
- Company Mosaic Scores to evaluate startup health, based on our National Science Foundation-backed algorithm
- Business Relationships to quickly see a company’s competitors, partners, and more
- Market Sizing Tools to visualize market growth and spot the next big opportunity